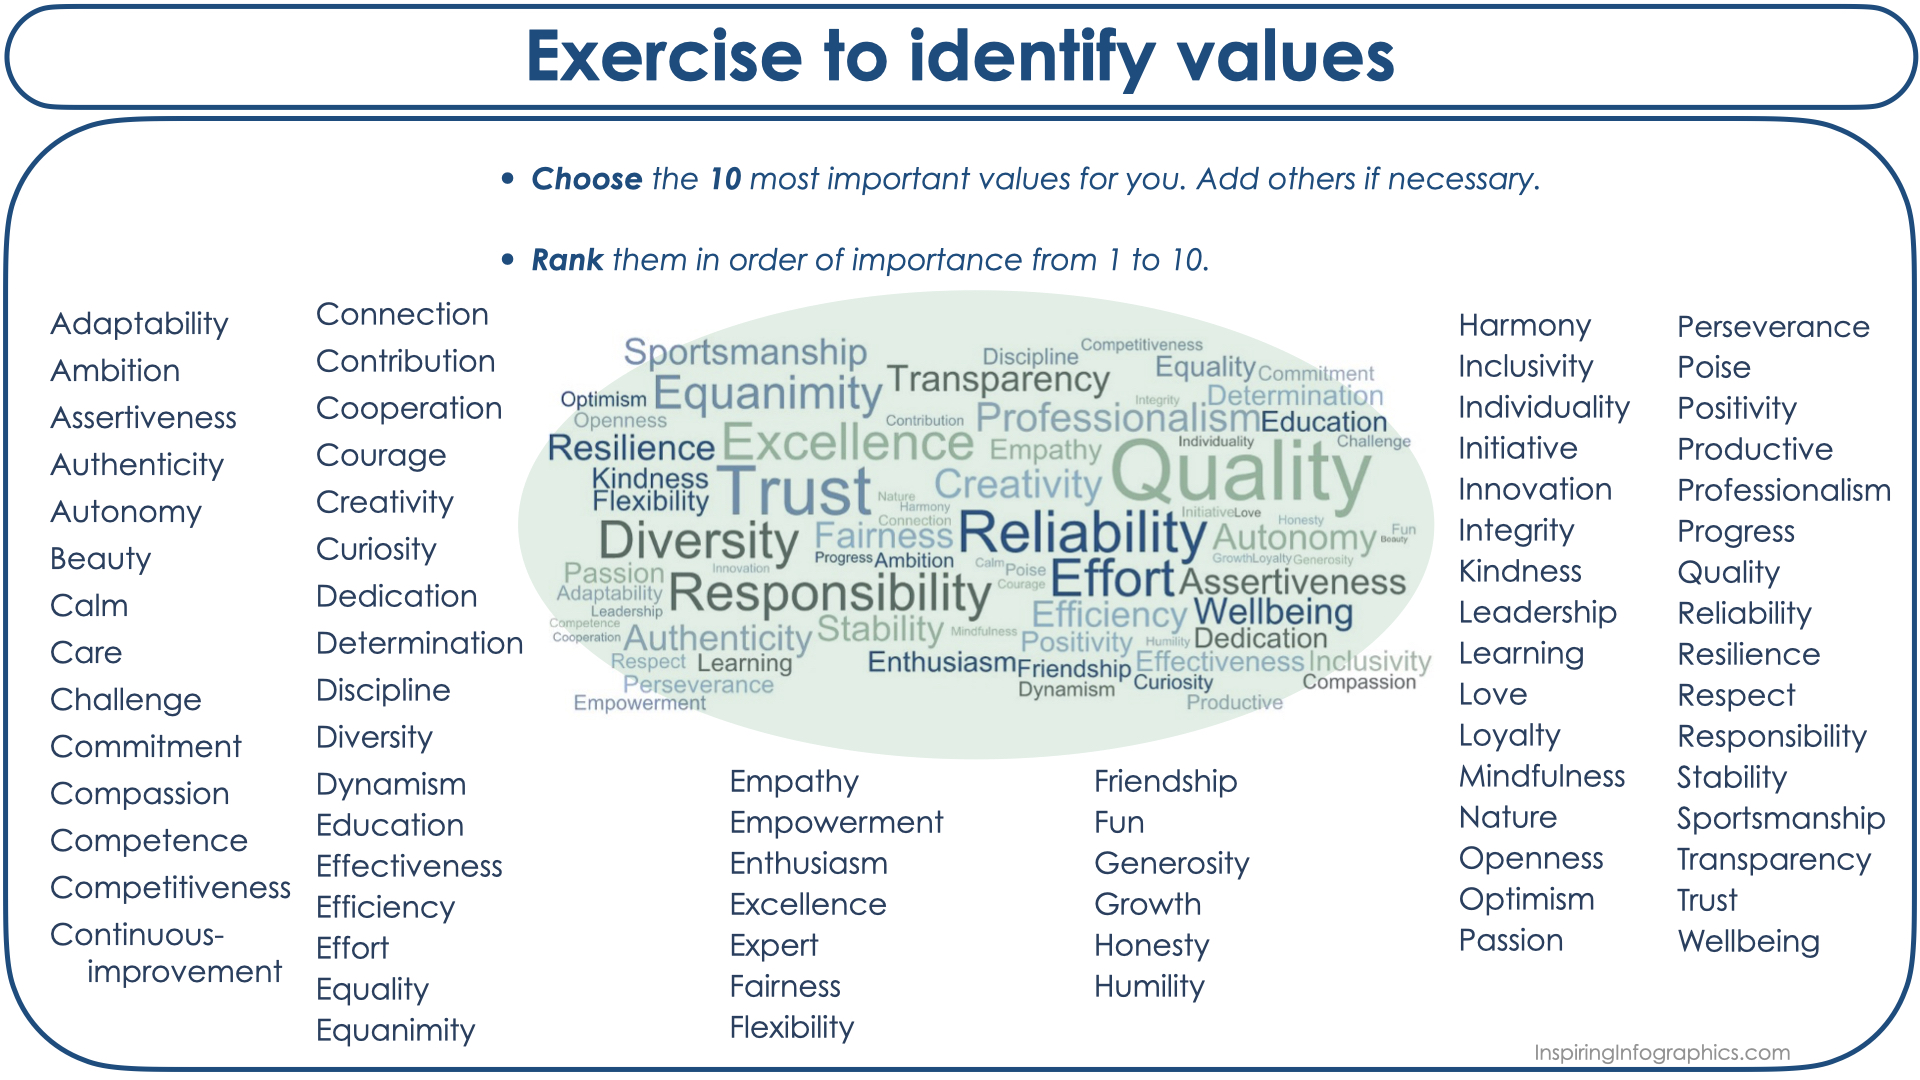
Just as people’s values guide their priorities, attitude and behaviour, in organizations they also represent the standards that direct them. In a leader, values can make her/his behaviour more oriented towards her/himself (e.g., needs and wants) or towards improving the people h/se leads. In an organization, values inspire its members, guide their behaviour, and differentiate the organization from others.
Valores
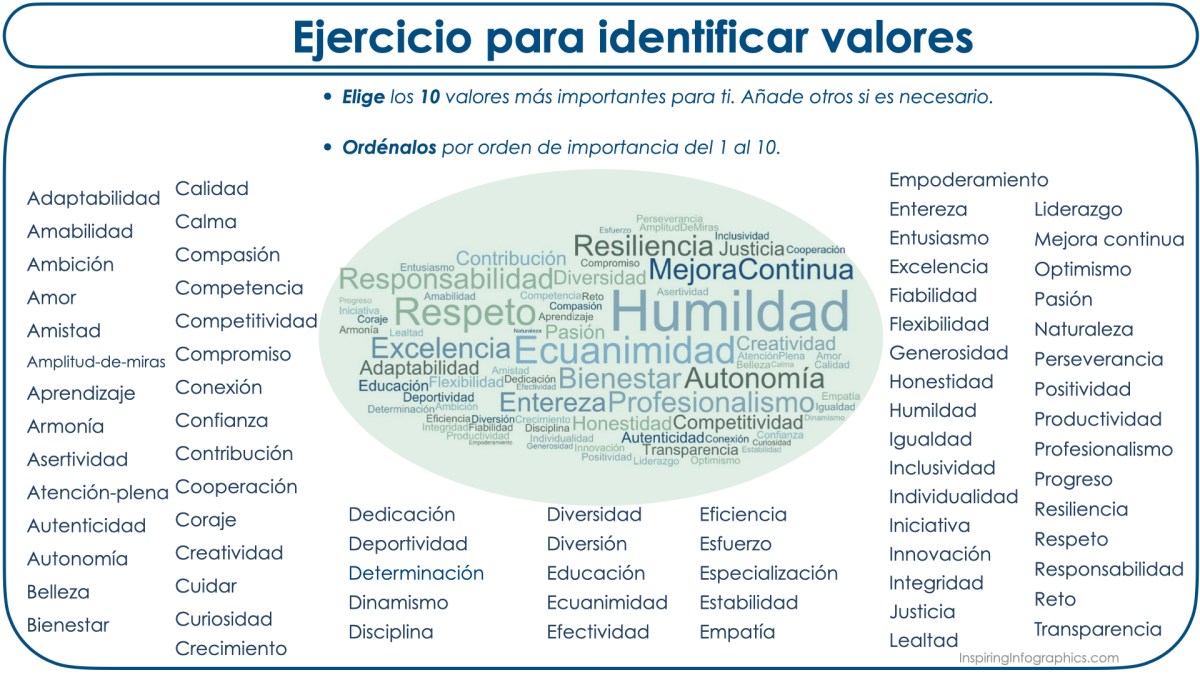
Así como los valores en las personas guían sus prioridades, su actitud y comportamiento, en las organizaciones también representan los estándares que las dirigen.En un líder, los valores pueden hacer que su comportamiento esté más orientado hacia sí mismo (necesidades y deseos) o hacia mejorar a la gente que lidera. En una organización, los valores hacen inspirar a sus miembros, guían su comportamiento, y diferencian a la organización de otras.
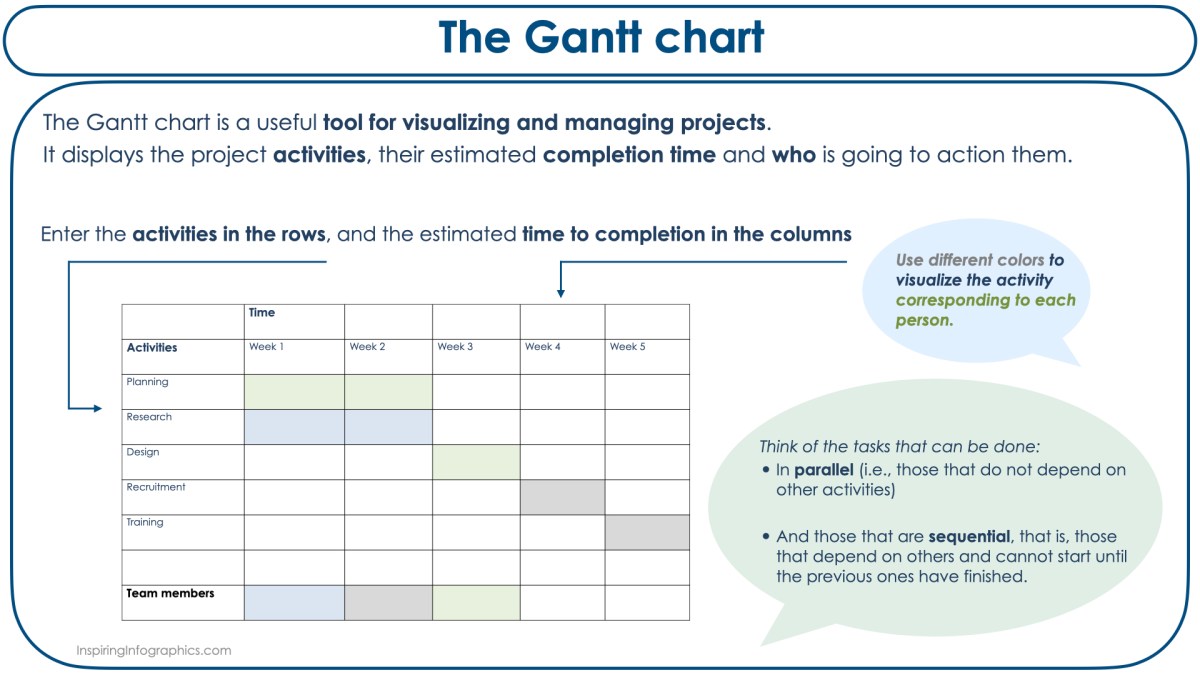
A very useful tool for visualizing and managing projects is the Gantt chart. This chart is able to display all the activities of a project, whether there is a relationship between them, the estimated time that each activity will take, and who is going to perform each activity.
Although there are software programs specialized to make these charts, they can also be done with Word or Excel. To begin, a list is made with all the activities and their estimated time of completion.
Then, all the different tasks are considered; those that can be done in parallel (i.e., those that do not depend on other activities), and those that are sequential, that is, those that depend on others and cannot be started until they are finished.
In the actual chart, activities are entered in the rows, and the timing in the columns. If more than one person is involved in the project, different colors can be used to visualize the activity corresponding to each person.
Using the Gantt chart has several advantages, one of them is to motivate the people involved in the project since they can clearly see the life of the project in perspective and understand why some activities have to be done before others.
El diagrama de Gantt
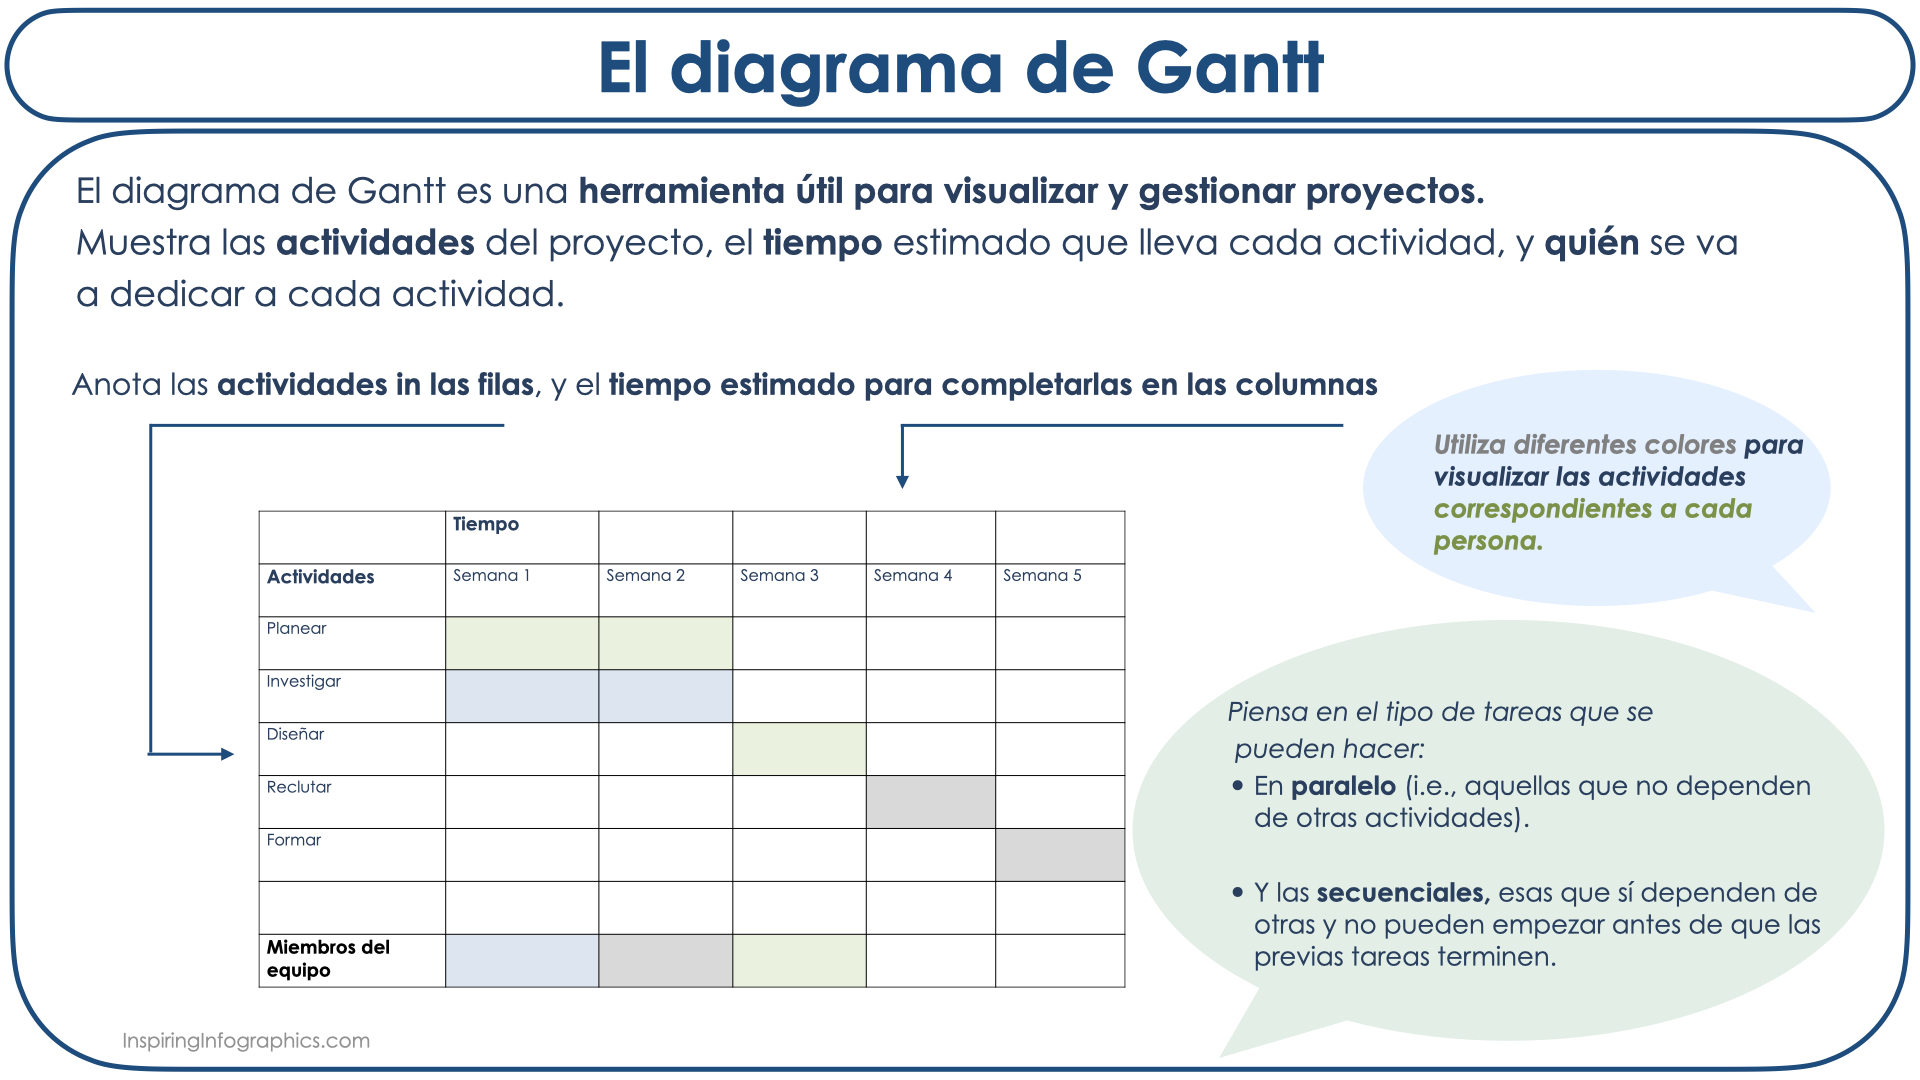
Para visualizar y gestionar proyectos, una herramienta que resulta muy útil es el diagrama de Gantt. Este diagrama es capaz de mostrar todas las actividades del proyecto, si hay una relación entre ellas, el tiempo estimado que lleva cada actividad, y quién se va a dedicar a cada actividad.
Aunque hay programas de software especializados en hacer estos diagramas, también se pueden hacer de manera sencilla con Word o Excel. Para comenzar hay que hacer una lista con todas las actividades y el tiempo estimado de finalización.
Después hay que diferenciar entre las tareas que se pueden hacer en paralelo (las que no dependen de otras actividades), y las que son secuenciales, es decir las que dependen de otras y no se pueden empezar hasta que estas finalicen.
Las actividades se anotan en las filas, y las fechas de inicio y finalización en las columnas. Si más de una persona está involucrada en el proyecto, se pueden utilizar diferentes colores para visualizar la actividad que le corresponde a cada persona.
Utilizar el diagrama de Gantt tiene varias ventajas. Una de ellas es la de motivar a la gente envuelta en el proyecto ya que pueden ver en perspectiva y con claridad la vida del proyecto y entender por qué hay que hacer unas actividades antes que otras.